×
Discover the World's Best Spices:
From Tradition to Innovation!
Hi, We Are Kore Agro !
Since 2015, we've been exporting and importing spices, oilseeds and herbs worldwide. Currently, we export to over 81 countries and import from more than 9 countries. Our rapid growth over these 9 years is a testament to our commitment to quality. As our tagline says,
"We grow Quality, We harvest Trust."
Why We're Your Perfect Choice


Top Quality At Competitive Prices

No Artificial Colors and Pesticides

Just-In-Time Delivery

Morethan 1500+ happy customers

Experienced, Knowledgeable Staff

Moisture Free Packaging

Widespread Market
Growth Trajectory of Kore International: Export Value (USD) and Global Reach (Countries)
| 2015 | 2016 | 2017 | 2018 | 2019 | 2020 | 2021 | 2022 | 2023 | 2024 | ||
|---|---|---|---|---|---|---|---|---|---|---|---|
| Growth Chart of Kore International | No. of Exporting Countires | 3 | 9 | 22 | 31 | 45 | 49 | 57 | 65 | 73 | 81 |
| Export value in million (USD) | 1.20 | 3.01 | 4.82 | 5.90 | 7.67 | 10.36 | 14.51 | 18.13 | 22.66 | 28.33 |
| 2015 | 2016 | 2017 | 2018 | 2019 | 2020 | 2021 | 2022 | 2023 | 2024 | ||
|---|---|---|---|---|---|---|---|---|---|---|---|
| Growth Chart of Kore International | No. of Importing Countries | 0 | 1 | 1 | 3 | 3 | 5 | 6 | 6 | 8 | 9 |
| Import value in million (USD) | 0.06 | 0.15 | 0.24 | 0.30 | 0.38 | 0.52 | 0.73 | 0.91 | 1.13 | 1.42 |
| 2015 | 2016 | 2017 | 2018 | 2019 | 2020 | 2021 | 2022 | 2023 | 2024 | ||
|---|---|---|---|---|---|---|---|---|---|---|---|
| Growth Chart in No. of Countries | KI's Global Footprint: Export Countries | 3 | 9 | 22 | 31 | 45 | 49 | 57 | 65 | 73 | 81 |
| KI's Global Footprint: Import Countries | 0 | 1 | 1 | 3 | 3 | 5 | 6 | 6 | 8 | 9 |
| 2015 | 2016 | 2017 | 2018 | 2019 | 2020 | 2021 | 2022 | 2023 | 2024 | ||
|---|---|---|---|---|---|---|---|---|---|---|---|
| Growth Chart in million (USD) | KI's Export Value in USD Millions | 1.20 | 3.01 | 4.82 | 5.90 | 7.67 | 10.36 | 14.51 | 18.13 | 22.66 | 28.33 |
| KI's Import Value in USD Millions | 0.06 | 0.15 | 0.24 | 0.30 | 0.38 | 0.52 | 0.73 | 0.91 | 1.13 | 1.42 |
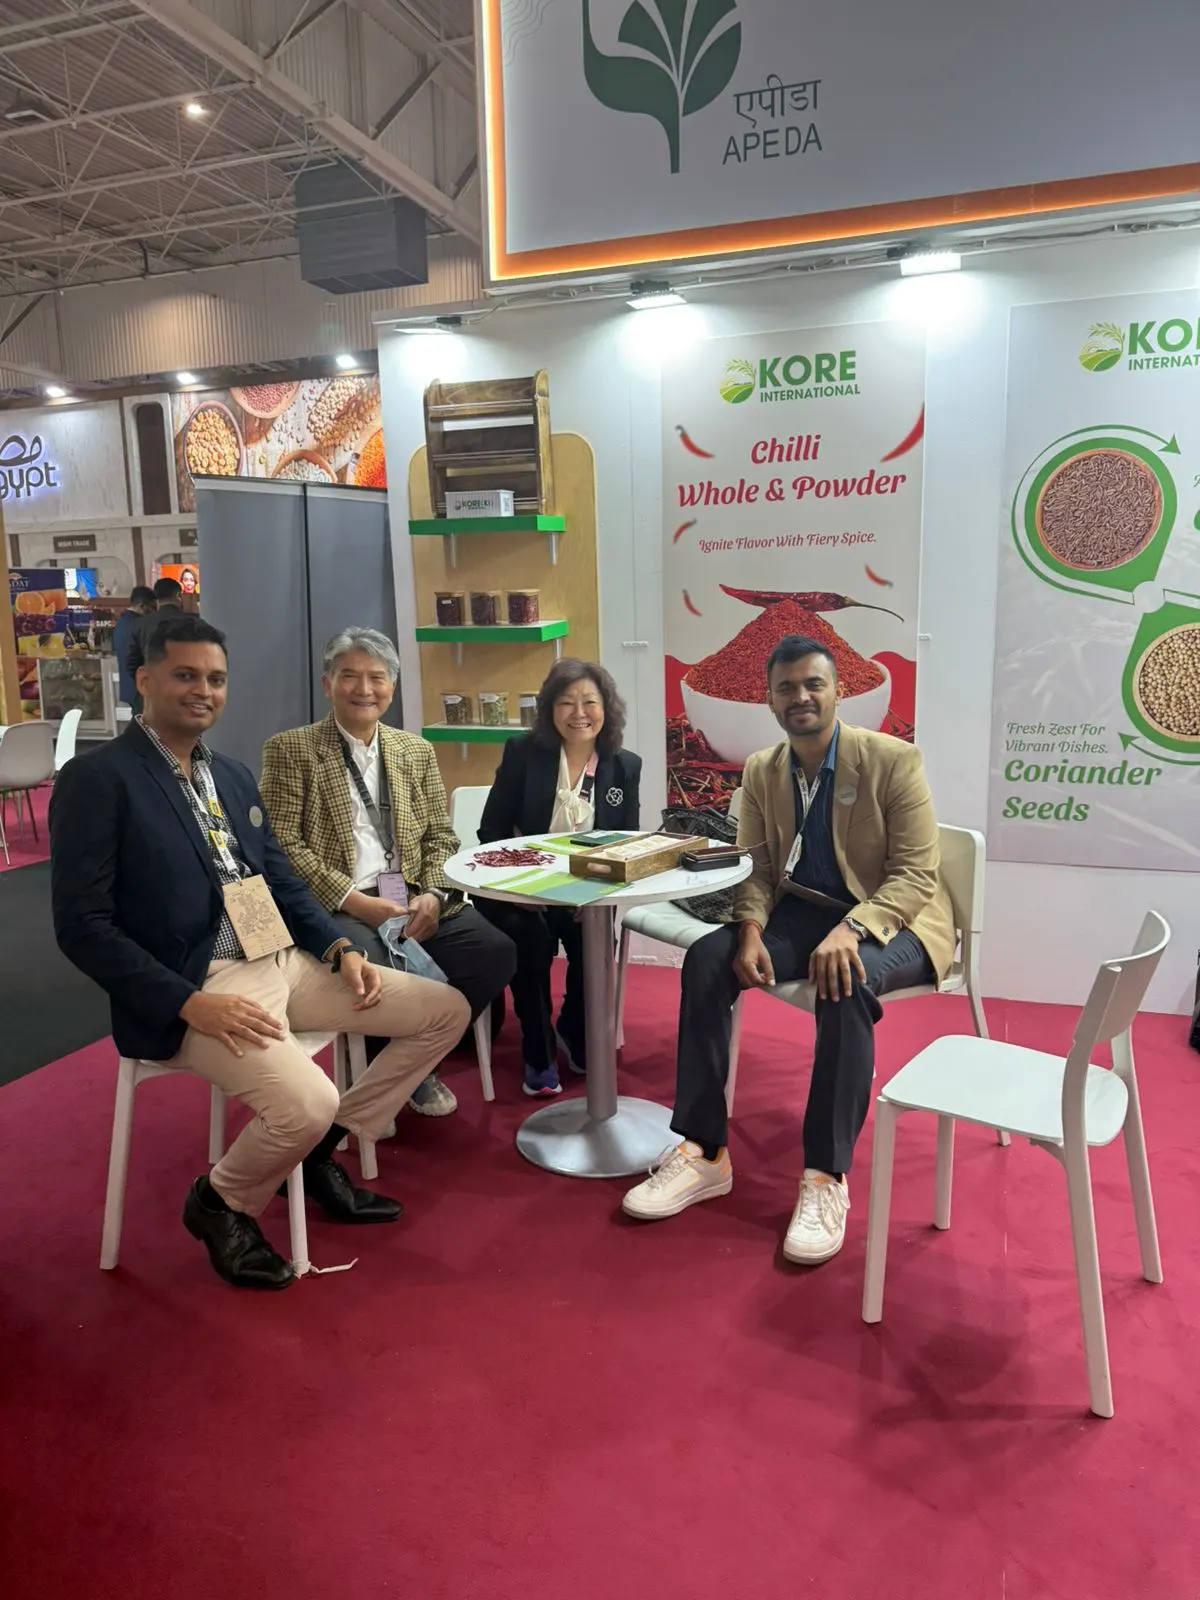
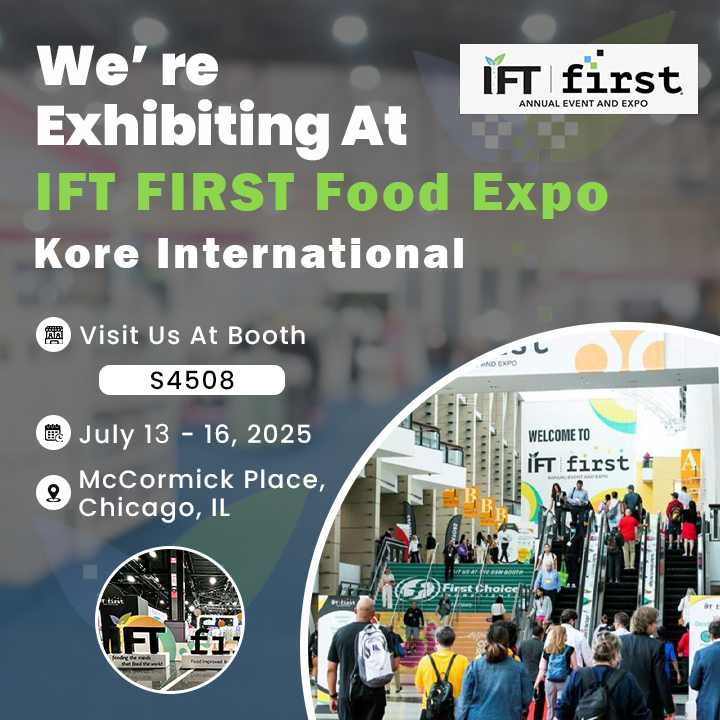
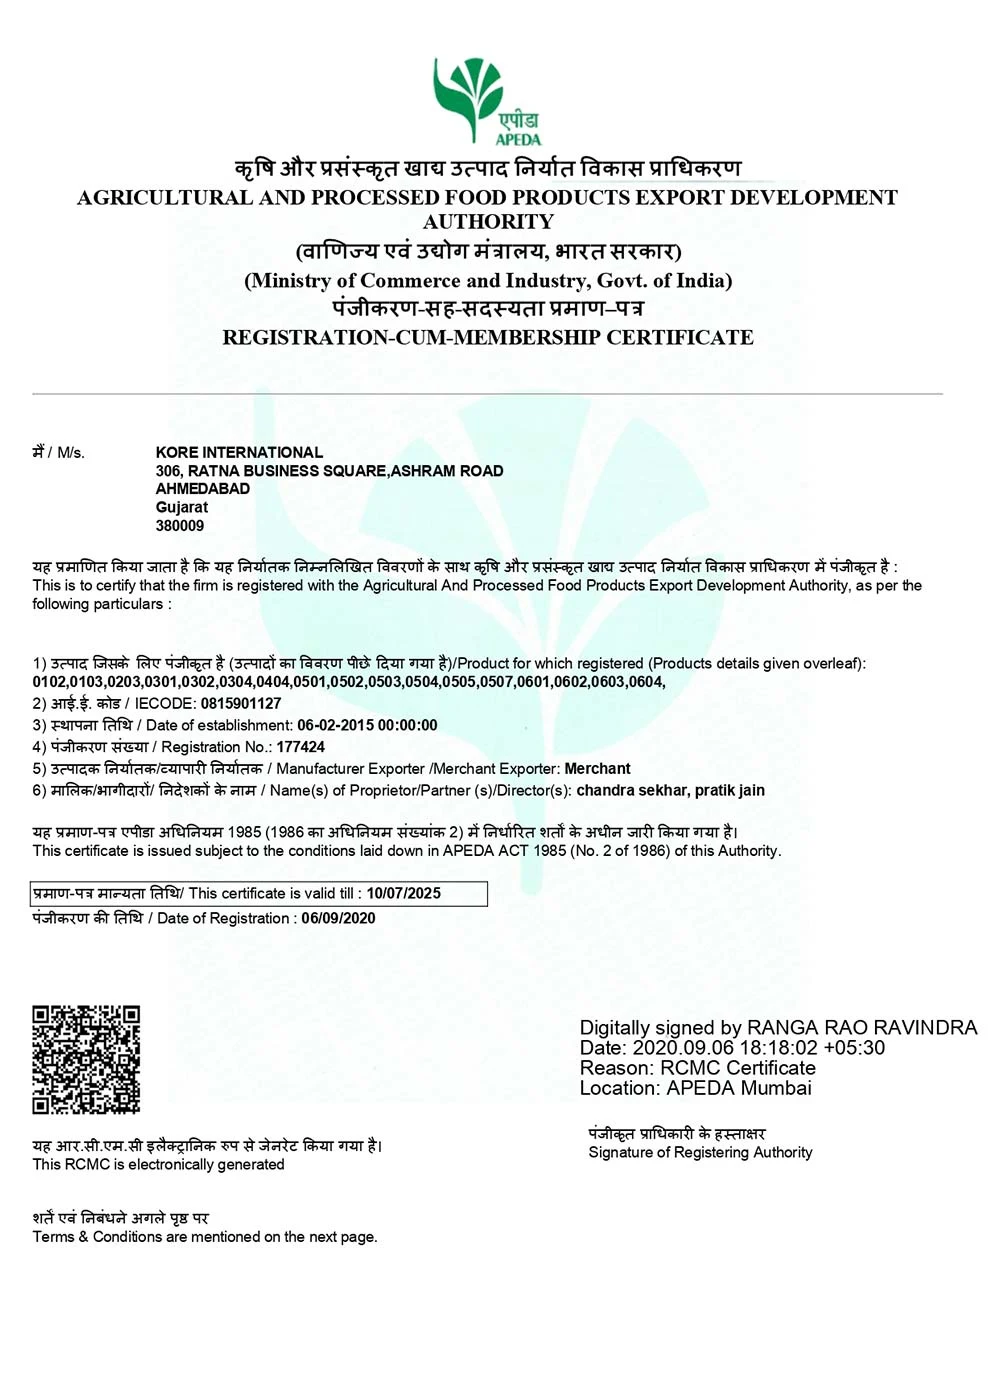
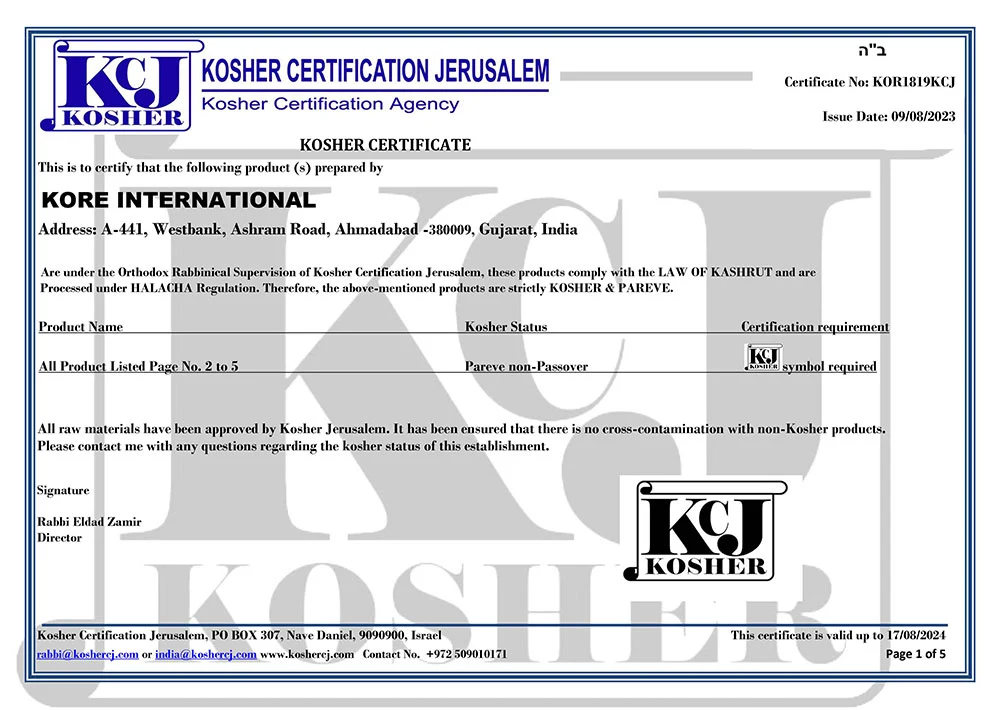
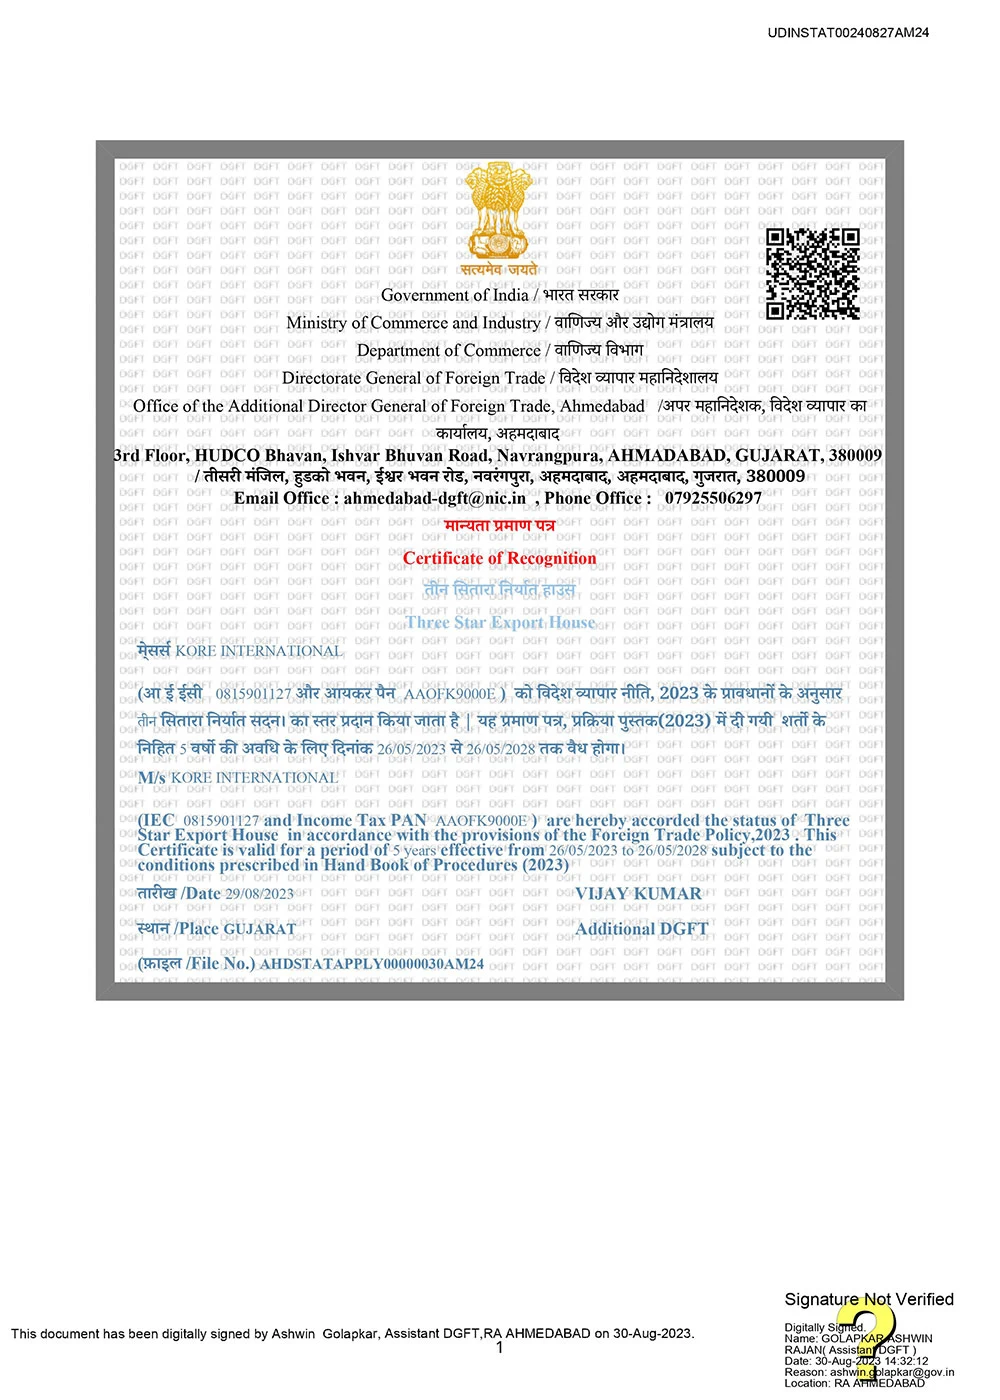
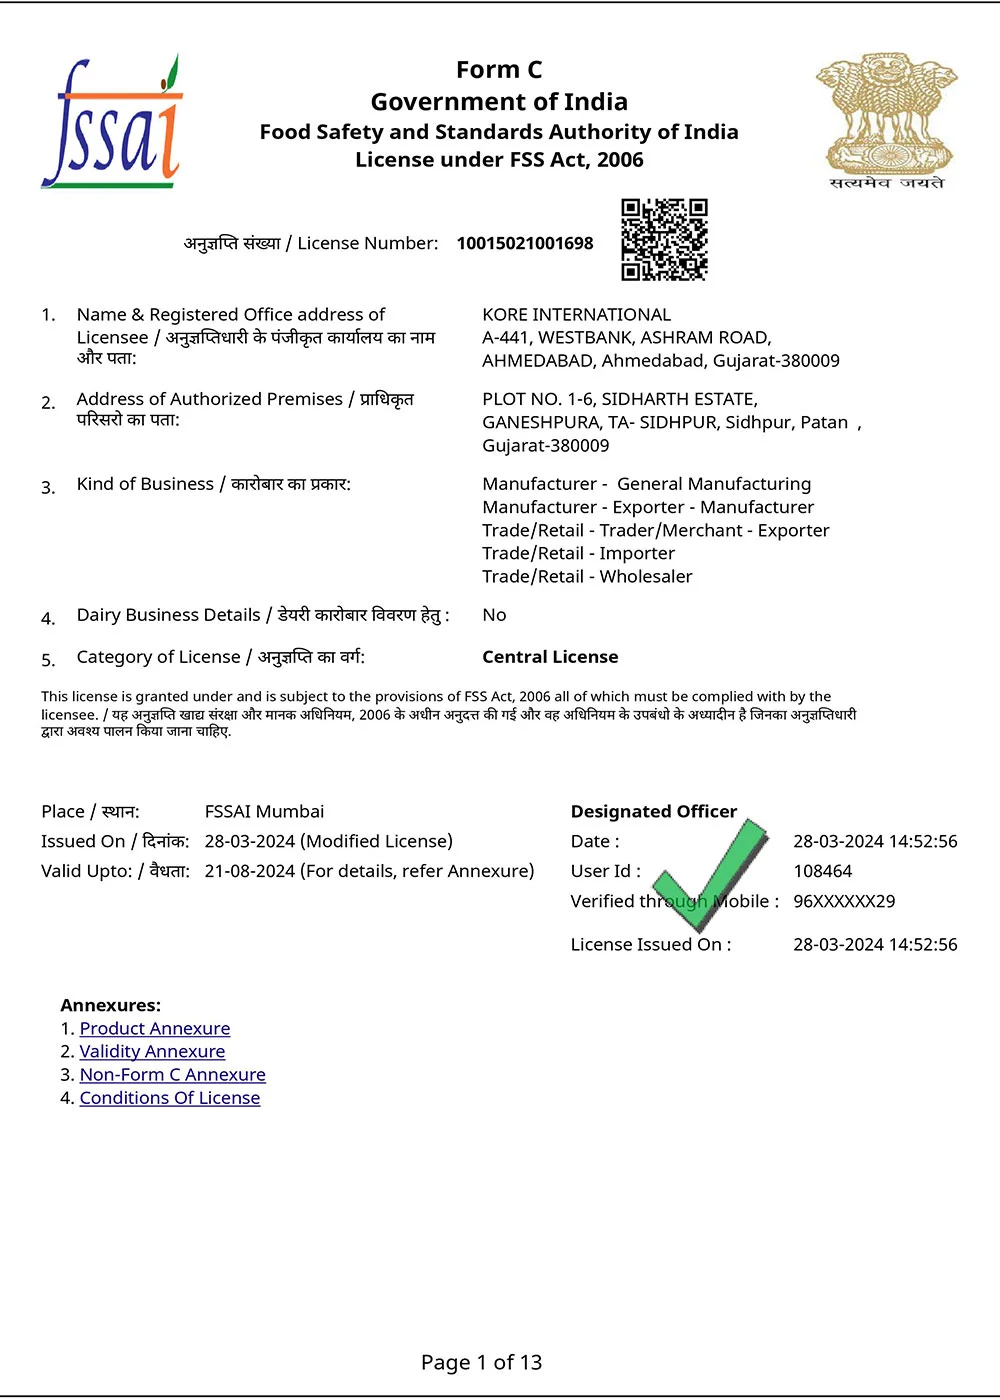
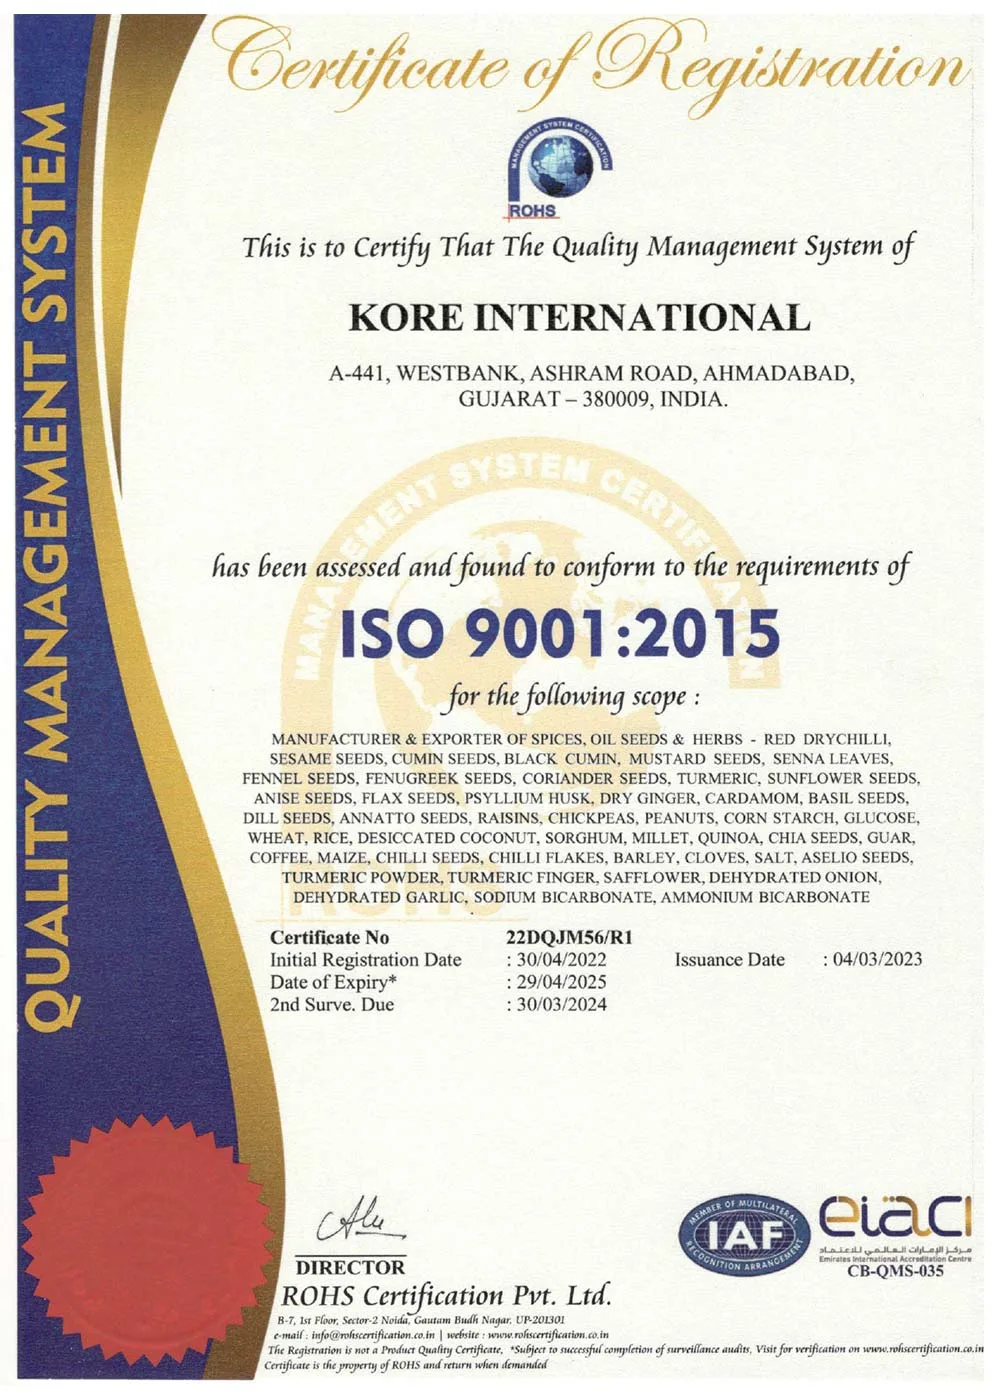
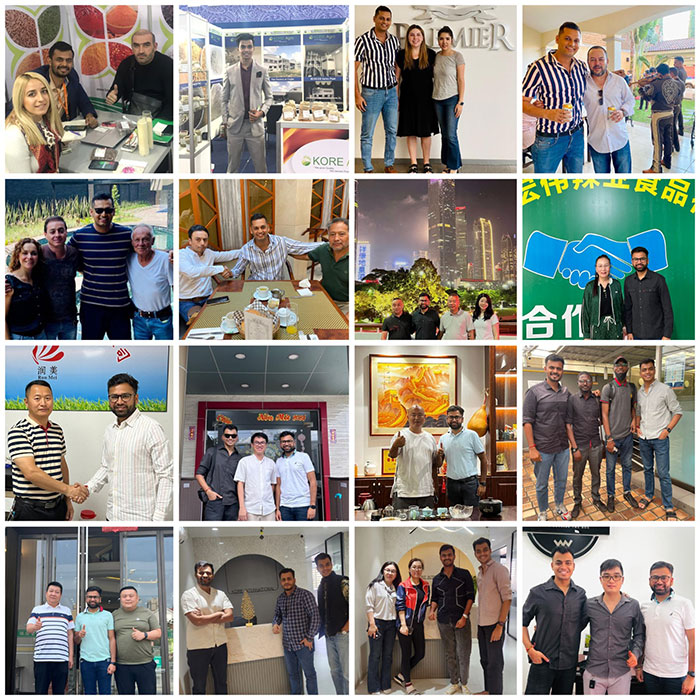
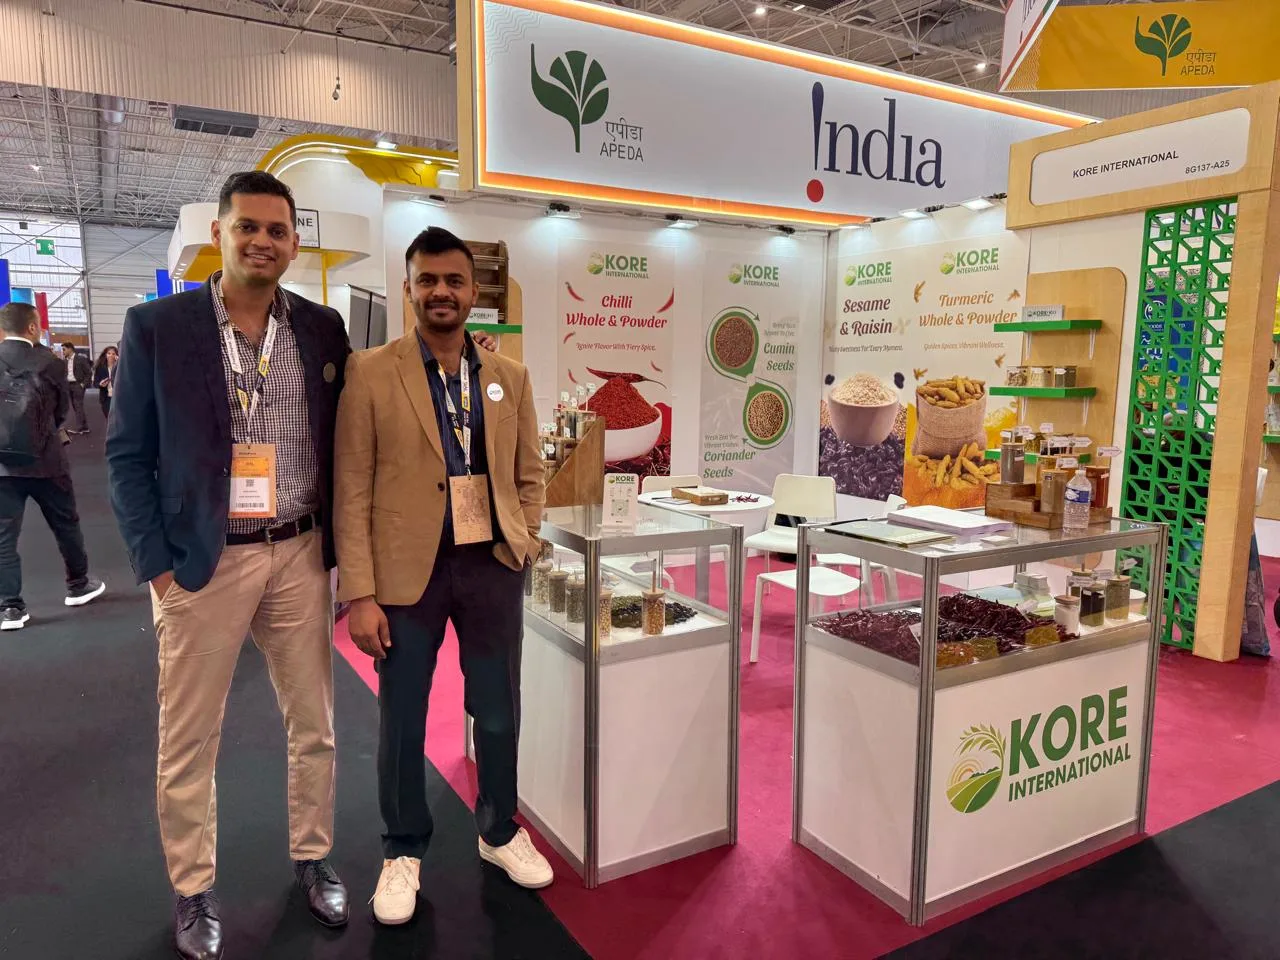
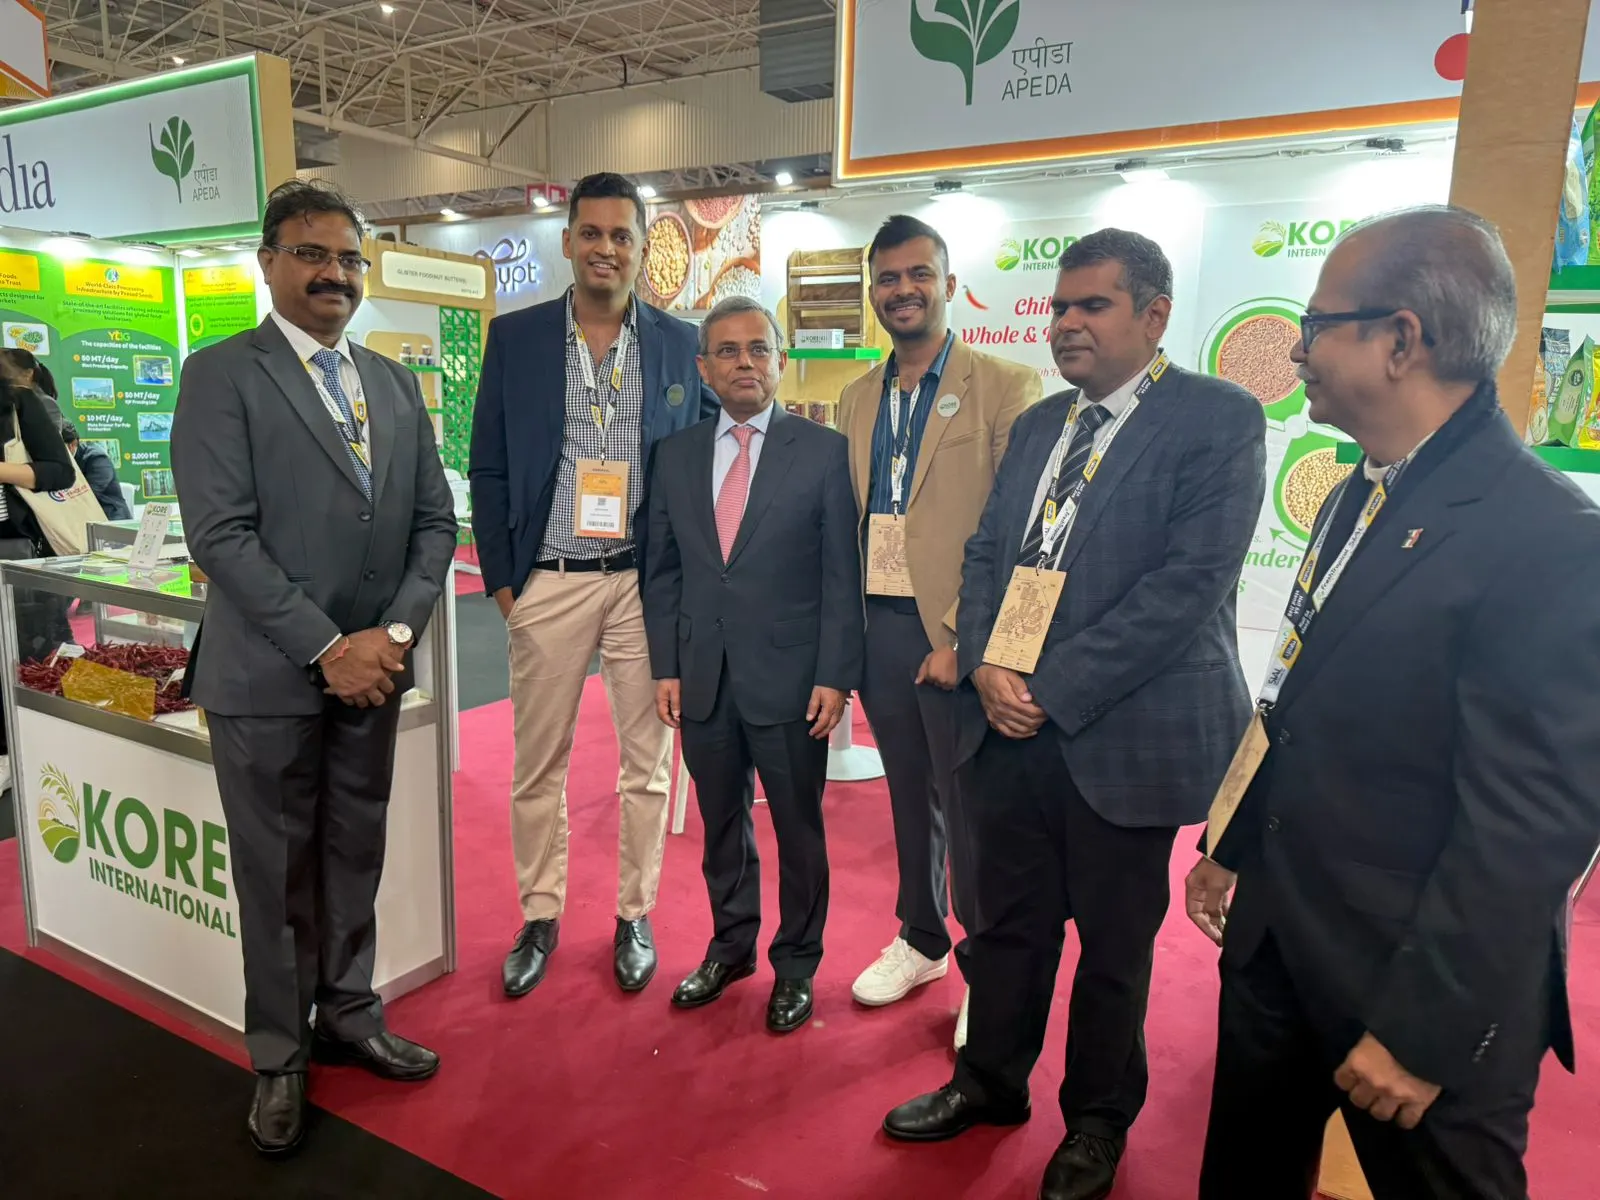
Proof of Excellence


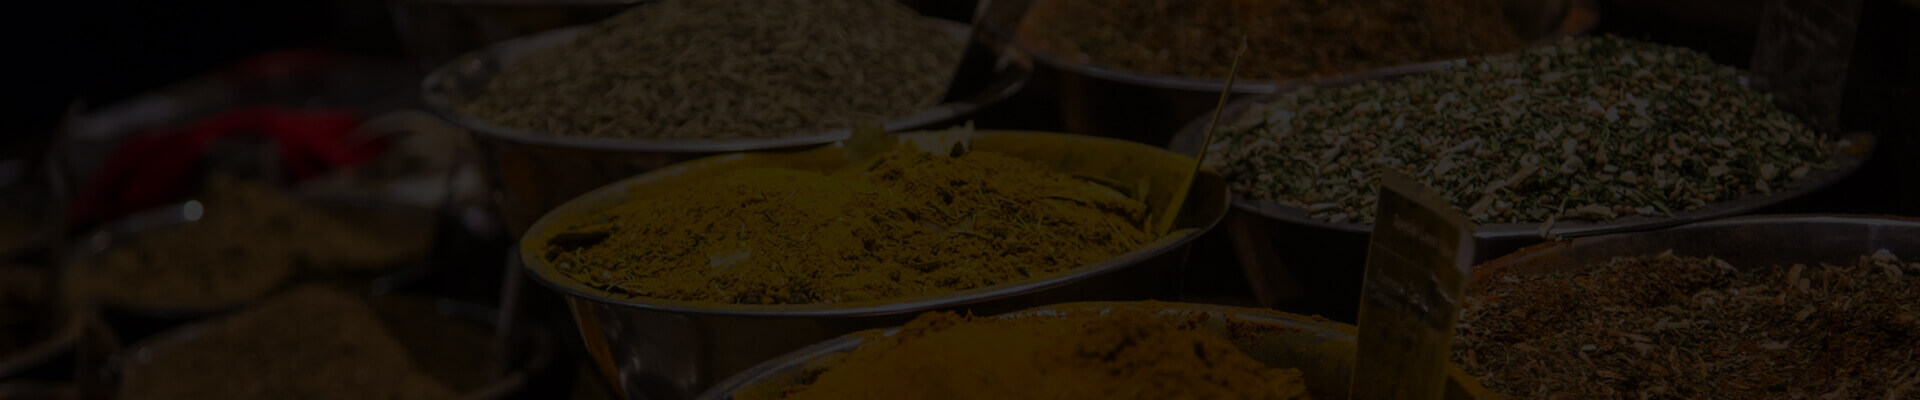
Exhibition Highlights

.jpg)
.jpg)